View logged events
If you have permissions you can view logged events including errors, warnings, fatal events, and information messages.

![]() You don't have to be an administrator, but you must be granted permissions to work with event logs.
You don't have to be an administrator, but you must be granted permissions to work with event logs.
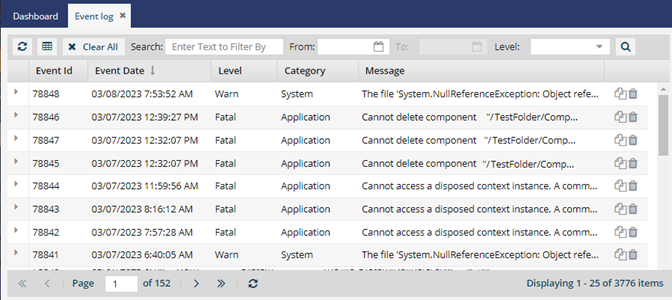
You can see details for each event in the following columns:
- Event ID - a unique number Inspire assigns to the event.
- Event Date - the Month, Day, and Year followed by the Hour, Minutes, Seconds.
- Logger Name - name of the application reporting the event.
- Thread Name - the name given to a set of instructions designed to be scheduled and executed by the CPU.
- Level - settings that indicate the severity of an event.
- Category - groupings that help organize events so you can filter them. The event log shows you data about usage and operations at all of the following Category levels:
- Message - additional information pulled from an event's Description property.
- Client Address - the IP address of the computer that made the request.
- Request Type - methods supported by HTTP used by the World Wide Web. You can filter by:
- Requested URL - Users request web server objects using URLs that are associated with a resource.
To view logged events:
-
From the top menu, select
 Event log.
-
On the Event log tab, show or hide any columns you want to search in.
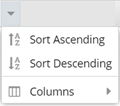
- Put your cursor next to the name of any column.
- Click the down arrow to see the column menu.
- To show a column that's currently hidden, select Columns and then select the checkbox for the columns you want to see.
- To hide a column that's currently displaying, select Columns and then select the checkbox for the columns you want to hide.
-
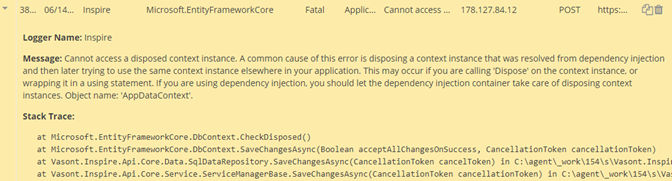
To see more details about an event, expand a log entry by clicking the expand arrow
 .
You can see more details in a yellow box.
.
You can see more details in a yellow box.